
How Can We Help?
Dashboard – Reports
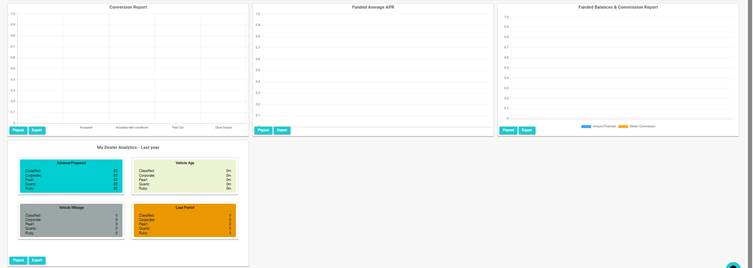
On the dashboard, there are four reports which deliver key reporting points for a dealer.
- Conversion Report: Lists the percentage of applications broken down by Accepted, Documents available & Paid out.
- Funded Average APR: Displays the average APR for applications over the last 30 days (Useful for creating representative examples)
- Funded Balance & Commission: Displays two columns showing the funded balances for the current month and the amount of commission payable.
- My Dealer Analytics – Last Year: includes averages of advances by lender group, average vehicle age by lender group, average mileage by lender group, and the average loan period by lender group.
Each report has two options.
- Popout
- Export
- Popout allows you to select a date range to filter the data. Simply enter the data and click on filter.
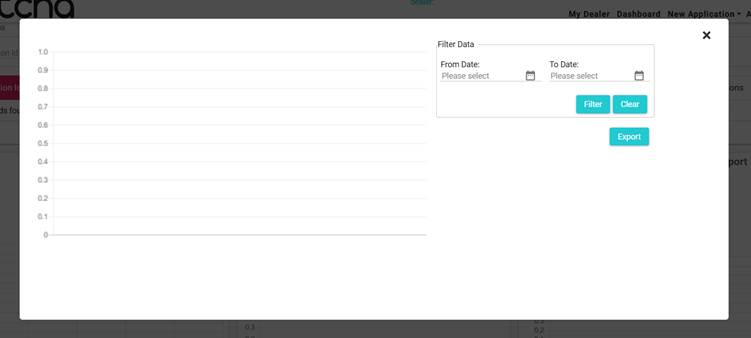
This data can then either be viewed on the screen or exported to Excel for future use.
- Each report can be exported into Excel. simply click the export button to begin the download.
Note: For users with more than one Dealership, only the active dealership data will show here. To switch, select the dealer from the drop-down located on the top right, or refer to this article for more information. Multiple Dealerships